Dataset Operations#
[1]:
import pyearthtools.data
import warnings

with warnings.catch_warnings(action="ignore"):
    import site_archive_nci
Variables#
[2]:
var = 'tcwv'
Builtin Operations#
pyearthtools.data provides a couple useful operations which can be applied to any DataIndex,
As of the writing of this Notebook, the following operations are accessible from the DataIndex
Range
Aggreagtion
Other operations are also implemented, and accessible at pyearthtools.data.operations
[3]:
era5 = pyearthtools.data.archive.ERA5(var)
Range of Data#
Lets find the range of data in March 2021, with data retrieved at hourly intervals
[4]:
era5.range('2021-03-01', '2021-04-01', interval = (1, 'hour'))
[4]:
{'tcwv': {'max': dask.array<_nanmax_skip-aggregate, shape=(), dtype=float64, chunksize=(), chunktype=numpy.ndarray>,
  'min': dask.array<_nanmin_skip-aggregate, shape=(), dtype=float64, chunksize=(), chunktype=numpy.ndarray>}}
Aggregation#
Lets find the temporal mean of data in March 2021, with data retrieved at 6 hourly intervals
[5]:
era5.aggregation('2021-03-01', '2021-04-01', interval = (6, 'hour'), aggregation = 'mean')
[5]:
<xarray.Dataset> Size: 8MB
Dimensions:    (longitude: 1440, latitude: 721)
Coordinates:
  * longitude  (longitude) float32 6kB -180.0 -179.8 -179.5 ... 179.5 179.8
  * latitude   (latitude) float32 3kB 90.0 89.75 89.5 ... -89.5 -89.75 -90.0
Data variables:
    tcwv       (latitude, longitude) float64 8MB dask.array<chunksize=(182, 360), meta=np.ndarray>
Attributes:
    Conventions:  CF-1.6
    history:      2021-07-04 07:02:45 UTC+1000 by era5_replication_tools-1.9....
    license:      Licence to use Copernicus Products: https://apps.ecmwf.int/...
    summary:      ERA5 is the fifth generation ECMWF atmospheric reanalysis o...
    title:        ERA5 single-levels reanalysis total_column_water_vapour 202...
Aggregation: Aggregation mean from 2021-03-01T00 to 2021-04-01 at 0 days...[6]:
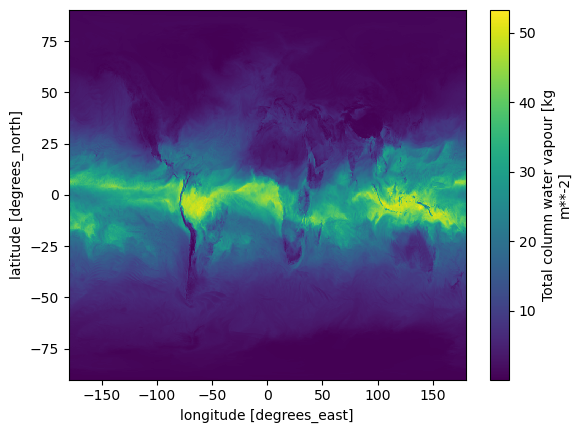
era5.aggregation('2021-03-01', '2021-04-01', interval = (6, 'hour'), aggregation = 'min').tcwv.plot()
[6]:
<matplotlib.collections.QuadMesh at 0x1545b19beb10>
Percentiles#
As there is no clear way to find percentiles with xarray.Dataset, a custom function is provided. It can retrieve any number of percentiles when given a Dataset
[7]:
pyearthtools.data.operations.percentile(era5('2021-01-01'), [1,5,95,99])
[7]:
<xarray.Dataset> Size: 64B
Dimensions:     (Percentile: 4)
Coordinates:
  * Percentile  (Percentile) int64 32B 1 5 95 99
Data variables:
tcwv (Percentile) float64 32B 0.4732 0.7271 52.75 60.32[ ]: