Execute this notebook to check you can load the data and libraries#
[ ]:
# Necessary import to run ENSO_Forecat and ENSO Gridded MLP notebooks
import pyearthtools.data
import pyearthtools.pipeline as petpipe
import site_archive_nci
import numpy as np
import pandas as pd
import matplotlib.pyplot as plt

from xgboost import XGBRegressor
from sklearn.preprocessing import StandardScaler
from sklearn.metrics import mean_squared_error, r2_score
import numpy as np
import scipy.stats


import warnings
import xarray as xr
#import plotly.express as px

import torch
import torch.nn as nn
import torch.optim as optim
import random
from sklearn.model_selection import train_test_split
[3]:
# Use pyearthtools data archive to access the data of interest
variables_of_interest = ['2t']
product = 'monthly-averaged'
accessor = pyearthtools.data.archive.ERA5(variables_of_interest, product=product) # Note - if you change 'product' to 'reanalysis' you can get the 6-hour timesteps
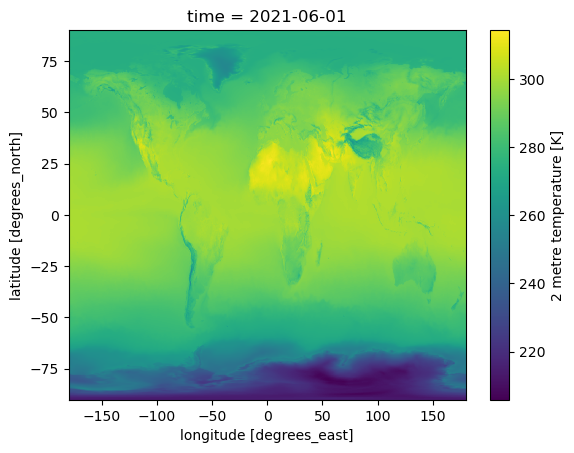
# Visualise the data on one sample
doi = '2021-06-09T06'
accessor[doi]['2t'].plot()
/opt/conda/envs/pet/lib/python3.11/site-packages/pyearthtools/data/indexes/_indexes.py:809: IndexWarning: Data requested at a higher resolution than available. hour > month
  warnings.warn(
[3]:
<matplotlib.collections.QuadMesh at 0x151bb2ed1c90>
[ ]: